|
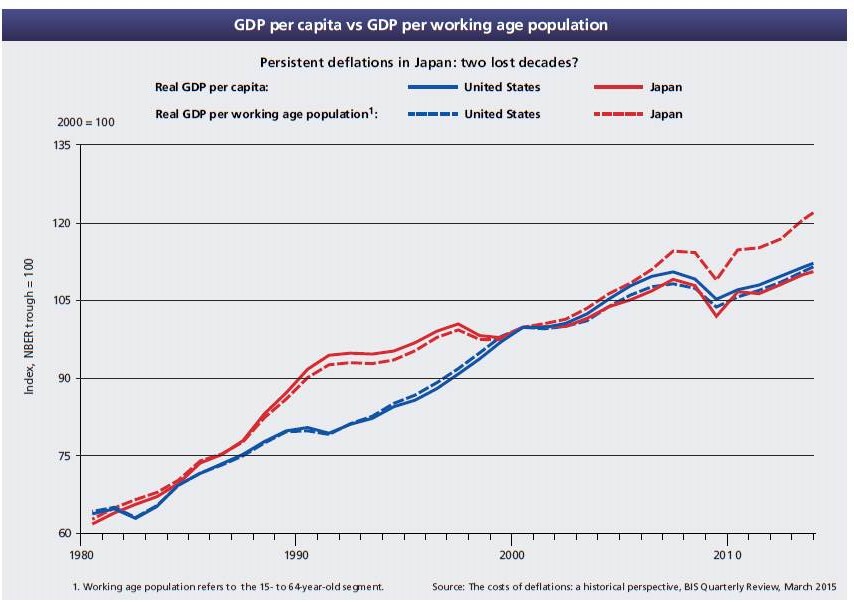
The following chart from the BIS shows GDP per actual working age population, and suddenly Japan doesn't look that bad anymore. It surpassed the United States in the early 2000s and the gap has increased ever since!
GDP per capita vs GDP per working age population, United States vs. Japan
1980 - 2015
Click on the chart for a larger view
|

