
|
|
| Pension asset allocation, Aggregate end 2008 versus end 2013 versus end 2018 |
Australia, Canada, Japan and the Netherlands
|
|
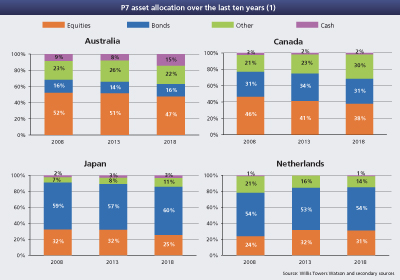
Click on the table for a larger version
|
Global Pension Assets Study 2019-Willis Towers Watson and secondary sources
08.09.2019
|
|
|
|
|
|
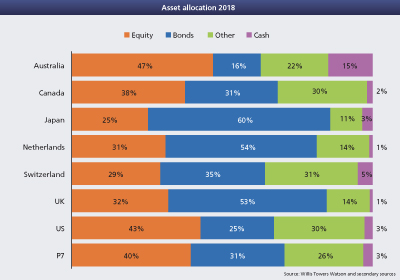
Asset Allocation 2018
Switzerland, U.K., U.S., P7 Australia, Canada, Japan, Netherlands
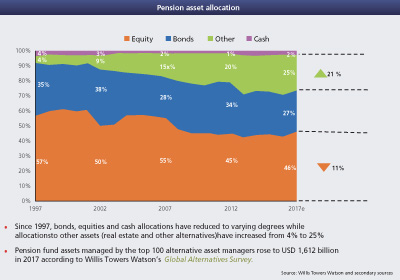
Asset Allocation
from 1998 to 2018
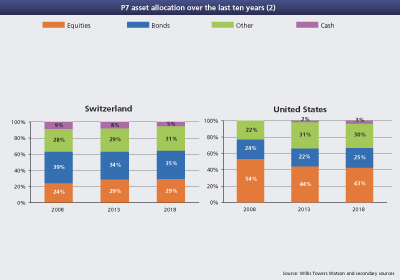
Asset Allocation
Switzerland and the U.S.
end 2008, vs. 2013 vs. 2018
|

