|
A reasonably diversified portfolio of stocks can expect to earn 7% per year on average. Thus, its easy to see that the expected payoff from investing $100 and holding for 30 years is $100*(1.07)^30=$761.23. The expected payoff, however, is subject to a lot of uncertaintyeven on a diversified portfolio the standard deviation is about 20% annually. Many people think that uncertainty washes out when you buy and hold for a long period of time. Not so, that is the fallacy of time diversification. Although the average return becomes more certain with more periods you dont get the average return you get the total payoff and that becomes more uncertain with more periods.
To illustrate I ran 100,000 simulations of a 30 year stock market investment with a 7% return and a 20% standard deviation. The mean payoff across all 100,000 runs was $759.58 (recall the theoretical mean is $761.23 so we are spot on). But now consider the following. What percentage of returns would you guess lost money, i.e. had a total payoff after 30 years of less than $100?
After 30 years, 8.9% of all returns lost money!!! In terms of recent debates, (average) r>g does not mean that wealth accumulates automatically. Fortunes can be lost even when the averages are in your favor.
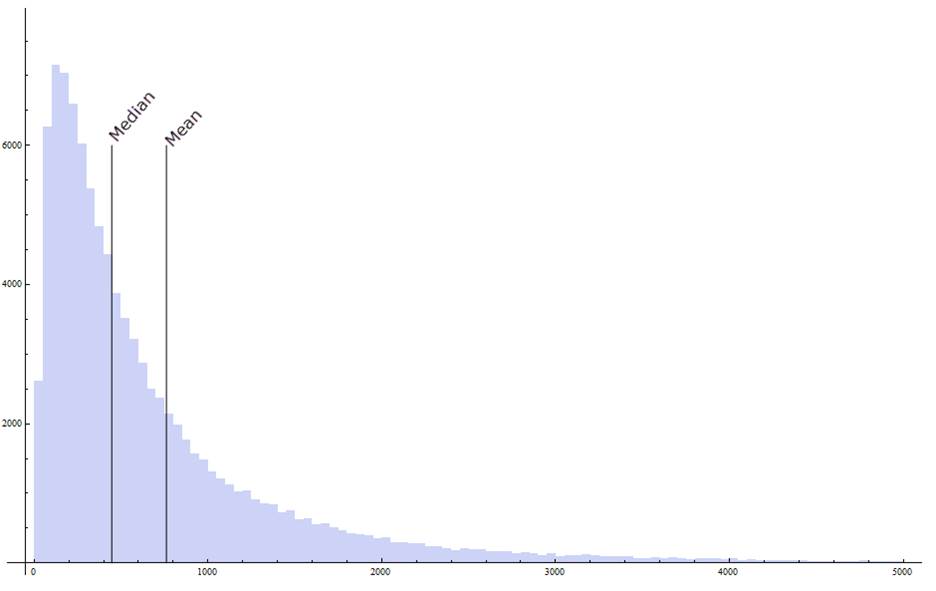
Perhaps even more surprisingly what percentage of investors would you guess earned less than the average payoff of $761.23? An amazing, 69.2% of investors earned less than the average. The median payoff in my simulation was only $446.85, so the median return was not 7% but 5.1%. The average investor earned less than the average return.
The point is subtle and widely misunderstood. Heres a simple example. Suppose that the average return is 10%. If $100 is invested for two periods the average payoff is $100*(1.1)^2=$121. But on average that is not what happens. More typically, you get say 0% in the first period and 20% in the second period, i.e. $100*(1.0)*(1.2)=$120. Notice that the average return is exactly the same, 10%, but the total payoff is smaller in the second and more realistic casean application of Jensens inequalityso the average investor earns less than the average payoff. The difference here is only $1 but over 30 years that seemingly small difference accumulates.
If most investors earn less than the average it follows immediately that a few must earn more than the average. Lady luck is a bitch, she takes from the many and gives to the few. Here is the histogram of payoffs. The right-hand tail is long. Indeed, I am only showing part of the tail as there were payoffs as high as $25,000. Most investors earn less than the mean payoff.
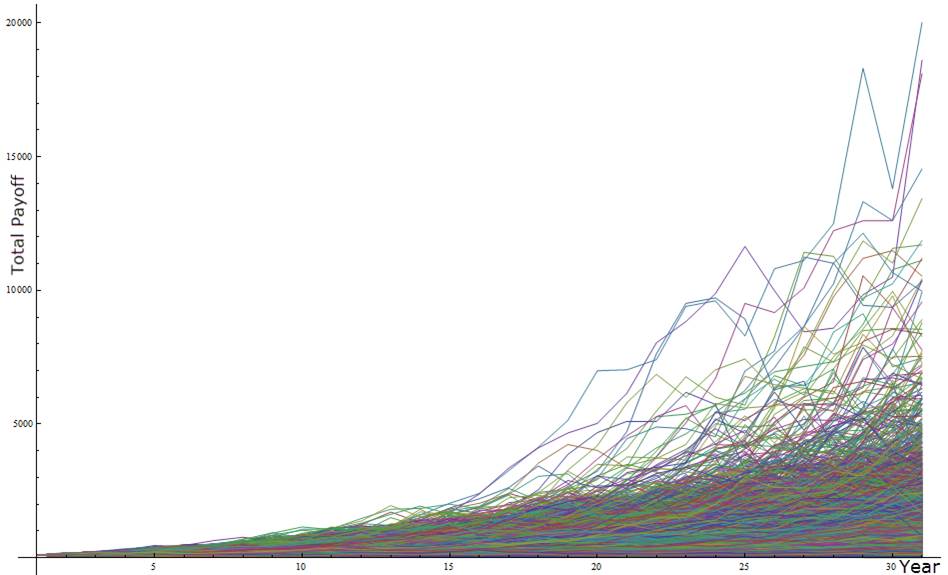
And here is a line plot showing the portfolio accumulation over time for a sample of 10,000 runs. Note two things. First, the variance of the total payoff is increasing over time and second, the total payoff is highly right (upper)-tailed.
Addendum: There is some evidence that stock market returns are mean reverting, as makes sense if discount factors are mean reverting. Taking mean-reversion into account would moderate the numbers somewhat but would not change the qualitative results. Moreover, we dont have many independent 30-year data points so in my view we shouldnt put too much weight on mean-reversion.
Source: www.marginalrevolution.com
| 
