|
Energy loans lack the balance sheet exposure to ripple systemically. Negative interest rates are poor monetary policy but apply only to a tiny portion of global bank reserves. Bank lending is improving in most of the world, including the US and Europe, and bank balance sheets are the healthiest theyve been in a generation. We believe the US and European financial systems are quite healthy and the risk of another near-term financial crisis is extremely low.
1. Potential Energy Loan Defaults Lack Scale
In the US, Energy loans account for just 3% of total loanstiny. Overall, US banks were already conservatively positioned with 1.5% of loans set aside to cover all potential bad debts. Even with this conservative buffer, banks modestly stepped up these provisions as a precautionary measure, further limiting potential energy fallout. Just 6% of outstanding Energy debt globally is on bank balance sheets, while 86% is in the bond market. (Exhibits 1 and 2)
Some compare Energy loans today to subprime mortgages and 2008s financial panic, but these fears lack credibility. Banks real estate exposure in 2007 amounted to 110 times their Energy exposure today. Plus, that 3% balance sheet exposure to Energy includes loans to huge integrated firms and state oil companiesneither have legitimate default risk. Even if half of the outstanding Energy loans were to defaultextremely far-fetchedthe conservative position of bank balance sheets is well-positioned to limit any major fallout from such an event.
Exhibit 1: US Energy Loans Are Just 3% of Bank Balance Sheets
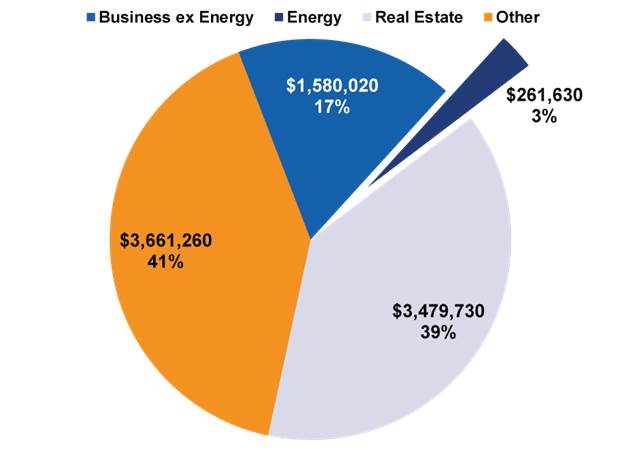
Source: FDIC and company filings, in USD Millions, as of 12/31/2015.
Exhibit 2: Global Energy Debt Outstanding
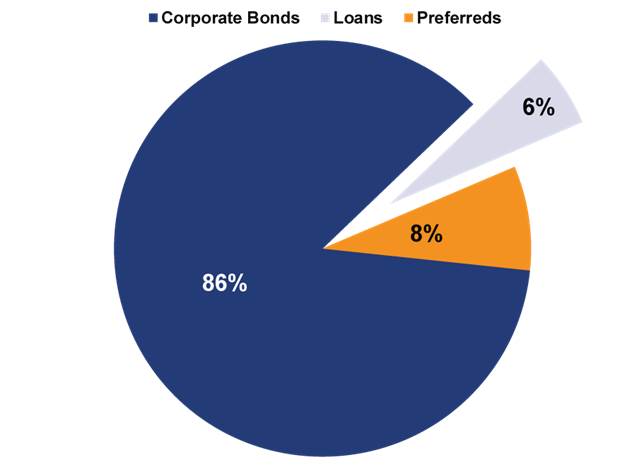
Source: Bloomberg, as of 12/31/2015.
2. Negative Interest Rates Arent Killing Bank Profits or Lending
Contrary to popular belief, negative rates in Europe and Japan arent destroying bank earnings. Most bank reserves actually pay interest. Moreover, loan growth is rising modestly in every major region, and credit standards arent tightening. (Exhibits 3-5)
Negative rates have existed in the eurozone since 2012, so its a bit odd that investors collectively decided to fear them in 2016.
We arent fans of negative rates. They are an extreme, misguided attempt to goad banks to lend and stimulate demand, which at best drives a couple more borrowers to market. To complicate matters, negative rate programs vary wildly across the countries using them. This results in a confusing set of tiered negative rates, zero rates and even positive rates on bank reserves held at each central bankwhen aggregated, negative interest rates apply only to 5% of total global bank reserves.
Global banks had a profitable 2015. Eurozone banks earned $74 billion, while paying approximately $1 billion to central banks as the negative rate tax. Some fear negative rates will come to the US, but this is extremely unlikely within the foreseeable future. The Fed currently pays 0.5% on excess reserves after hiking last December, and a strong labor market and healthy inflation suggest the Fed will continue slowly along the rate-hike path.
Exhibit 3: Bank Earnings per Share in the Eurozone and US Since 2012
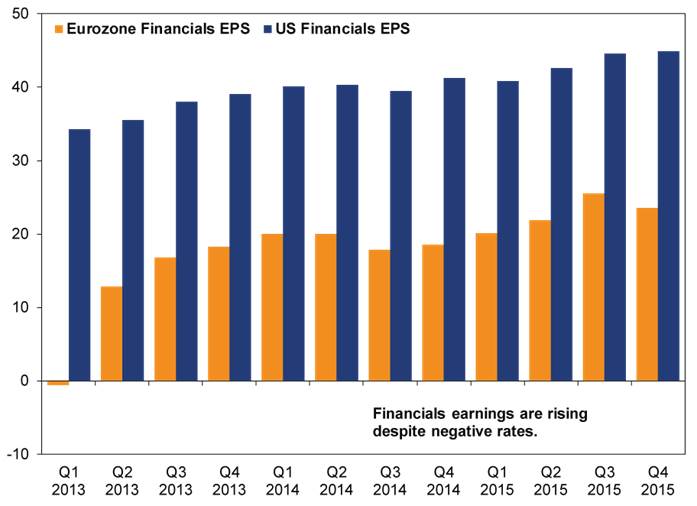
Source: FactSet, as of 12/31/2015. 12-month rolling earnings per share for MSCI USA Financials and MSCI EMU Financials.
Exhibit 4: Central Bank Reserves in the 10 Largest Banking Systems
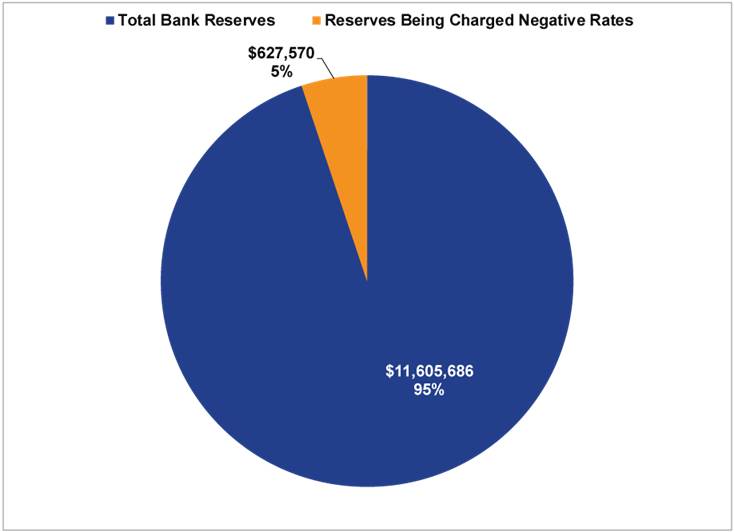
Source: Federal Reserve, ECB, BOJ, BOE, SNB, Central Bank of Canada, Bank of China, Bank of India, Central Bank of Brazil, Rikisbank of Sweden, in USD Millions, as of 2/28/2016.
Exhibit 5: Loan Growth Is Improving
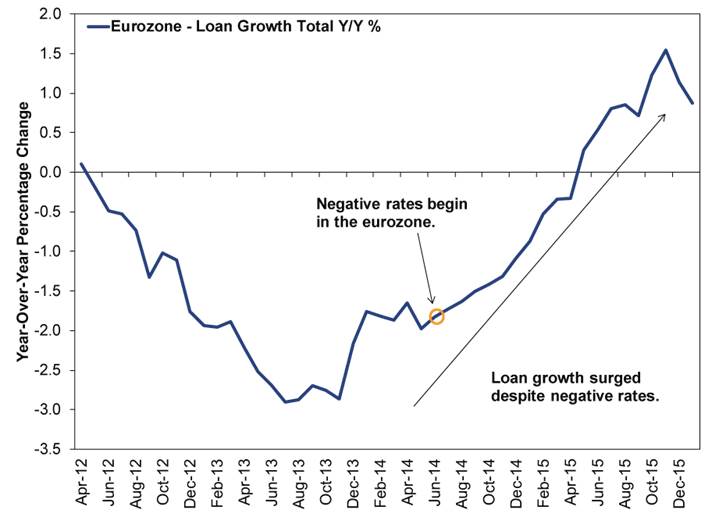
Source: FactSet, as of 2/28/2016.
3. Eurozone, UK & US Banks Are the Best Capitalized Theyve Been in Over a Decade
Eurozone banks have more capital today than any time in recent history. Tangible capital ratios have doubled from 6.3% in 2008 to 12.7% today. Eurozone banks have raised 235 billion in new Tier 1 Capital since 2007. Bank capital in the US, UK and eurozone together is approaching $1.6 trillion, nearly tripling since 2008. (Exhibits 6-7)
Fear of insufficient capital is pure recency biasa common behavioral error. Deutsche Banks weak quarterly earnings drove fears of system-wide trouble, but Deutsche Banks problems are company-specific, one-time issuesrestructuring charges and legal fines. They are not recurring charges that erode earnings indefinitely.
Exhibit 6: Eurozone Banks Total Tangible Common Equity
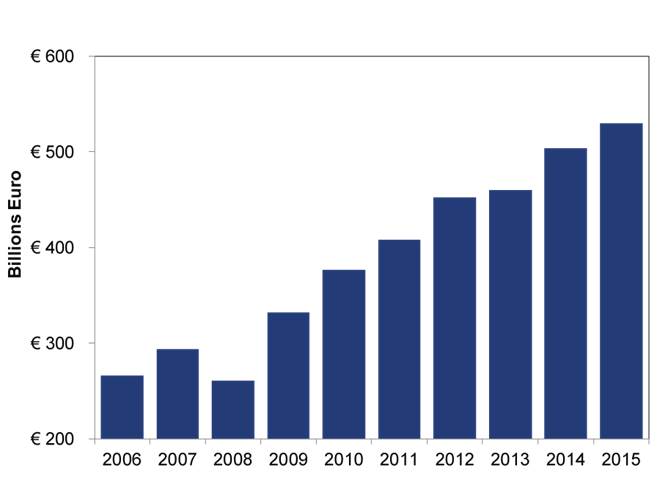
Source: Bloomberg and company filings, as of 12/31/2015.
Exhibit 7: Bank Capital in the US, UK and Eurozone
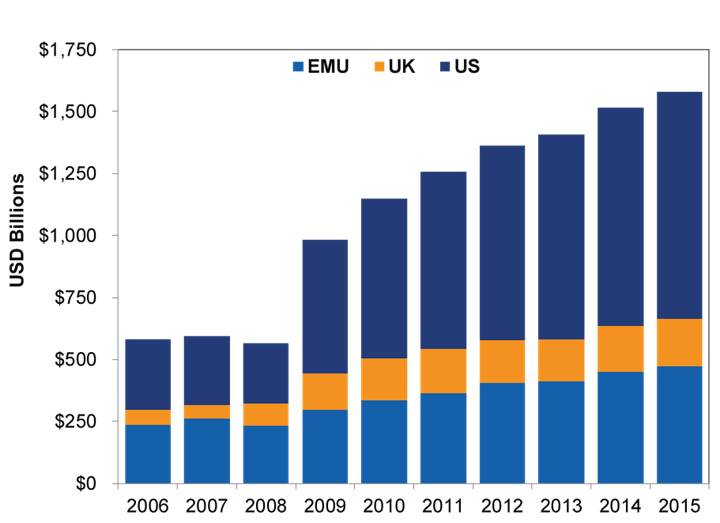
Source: Bloomberg and company filings, as of 12/31/2015.
4. Eurozone Bad Debts Are Improving, and New Loans Are Higher Quality
Eurozone banks non-performing loans (NPLs), while still elevated, have fallen since 2013. NPLs are a lagging indicator. They peak after a banking crisis. In the US, real estate NPLs peaked in 2010, well into the new bull market and economic expansion. Once they rolled over, asset quality continued improving for the next six years. This trend has held throughout history, and we expect similar in the eurozone banking system today.
Exhibit 8: Eurozone NPLs Peaked in 2013 and Continue Improving
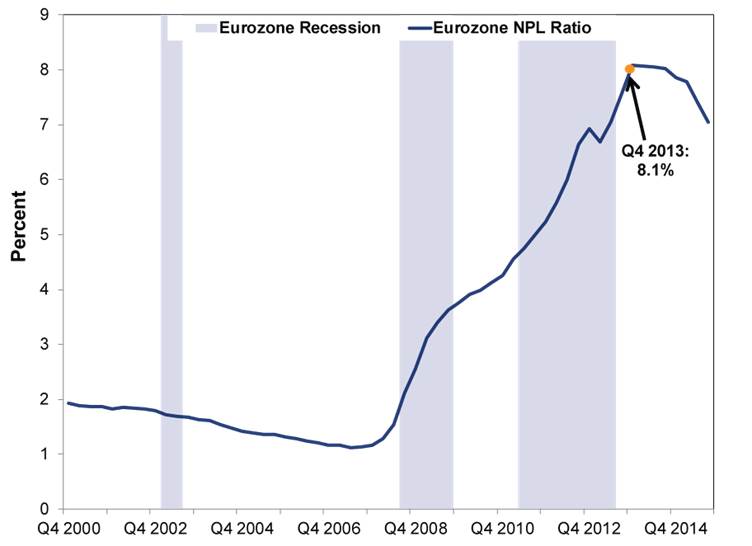
Source: European Central Bank, as of 12/31/2015. Aggregate NPLs of France, Italy and Spain are used as a proxy of the eurozone, as these countries provide consistent and timely reporting of system wide NPLs, which isnt the case in most eurozone countries.
Exhibit 9: US Real Estate NPLs Peaked After the Crisis
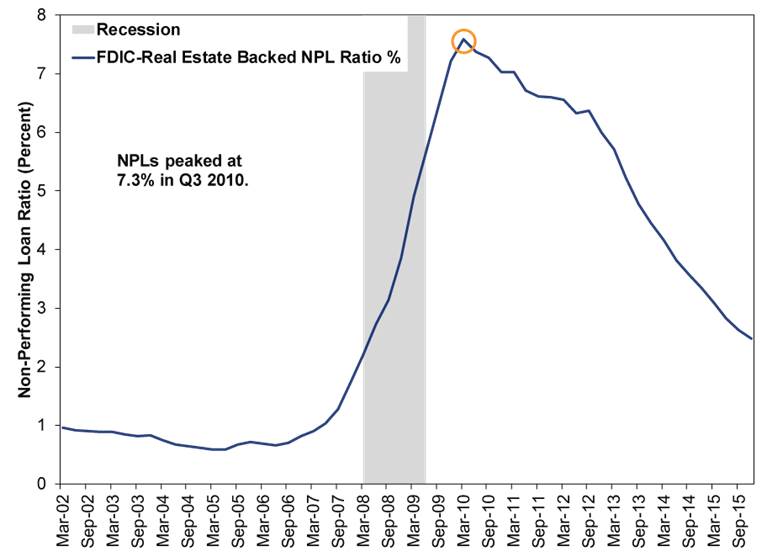
Source: FDIC, as of 12/31/2015.
Source: MarketMinder
| 
