|
It has been 50 trading days since the S&P 500 fell more than -0.5% in a day.[i] Do you know where your children are? While its tempting to think danger lurks under still watersand financial media provide prompts aplentycalm periods dont portend big price movements ahead. Nor do they herald further tranquility. Volatilitylow or high; up or downis incapable of foretelling the future.
Low volatility spans the world. US volatility is low whether you measure it by daily percent moves or the VIXs options-implied[ii] volatility. US stocks streak without a half-percent decline is the longest since 1968. Moreover, the S&P 500 has risen every month year to date on a total return basis, a first-ever.[iii] October registered the VIXs lowest monthly average on record (since 1990). Outside America, European stocks VIXVStoxxalso hit record lows. Japans Topix index hadnt fallen by -0.4% or more in 31 trading days until a recent spate of volatility last Friday. Up to then, the Nikkei VIX was near its lowest in a dozen years. Meanwhile, the MSCI All-Country World Indexs[iv] daily percent moves havent exceeded half a percent for a couple weeks. Thats some unvolatility! But none of this tells you about future moves. Stocks arent serially correlated. Past price movements, whether volatile or not, dont affect what happens next.[v] Volatility just describes what already happened. It is a measure of past performance, which is never predictive.
Some argue sanguine stocks in the face of seeming threatsgeopolitical, political, central bank-related or otherwiseare dangerously complacent. But markets deal efficiently with all widely known information, including headline fears. Yes, they can be irrational in the short term. But nothing widely feared today is new. Nor should stocks have some automatic reaction to any of the days news. While headlines dwell on an event or two, stocks consider everything thats going on. What if all the other (good) variables simply outweigh whatever headlines are scared of? What if what people dont talk about happens to be more meaningful (and positive) for future corporate profits?
In the very short term, sentiment wiggles drive stocks most. Markets are made of people, and investors arent immune to emotion. This is why the question of what caused stocks to wiggle by -0.2% on Tuesday is usually not answerable definitively, despite how media present it. Maybe its just Tuesday! But in the longer run, markets weigh reality: economic growth, political factors and how much investors appreciate both. This long-term path and its drivers matter most for investors, not whether the day-to-day price chart is squiggly along the way.
Volatility will probably return one day. But when it does, it could easily be upside volatility that brings bigger returns. While this years US returns have been goodamid low volatilitythey arent exactly rip-roaring. Returns to date are just around average for a bull market year. Some of our biggest bull market years have featured much higher volatility. (Exhibits 1 6)
Exhibit 1: 1996up 23.0%
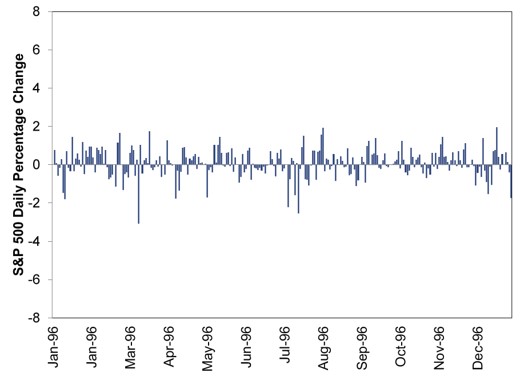
Source: Global Financial Data, Inc. and FactSet, as of 11/14/2017. S&P 500 annual total return and daily price movement, 12/29/1995 12/31/1996.
Exhibit 2: 1997up 33.4%
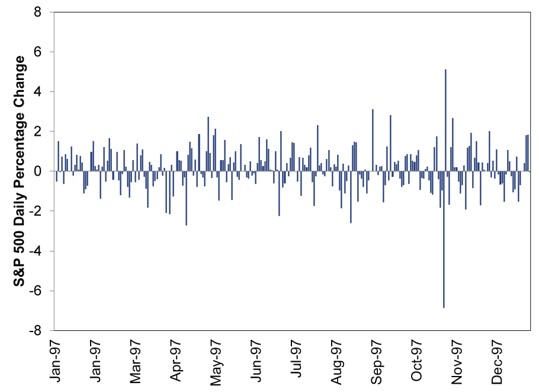
Source: Global Financial Data, Inc. and FactSet, as of 11/14/2017. S&P 500 annual total return and daily price movement, 12/31/1996 12/31/1997.
Exhibit 3: 1998up 28.6%
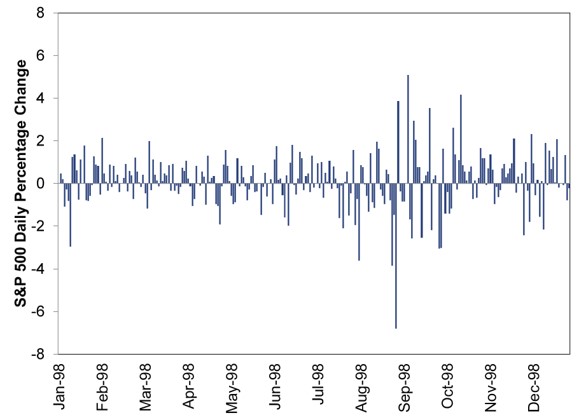
Source: Global Financial Data, Inc. and FactSet, as of 11/14/2017. S&P 500 annual total return and daily price movement, 12/31/1997 12/31/1998.
Exhibit 4: 1999up 21.0%
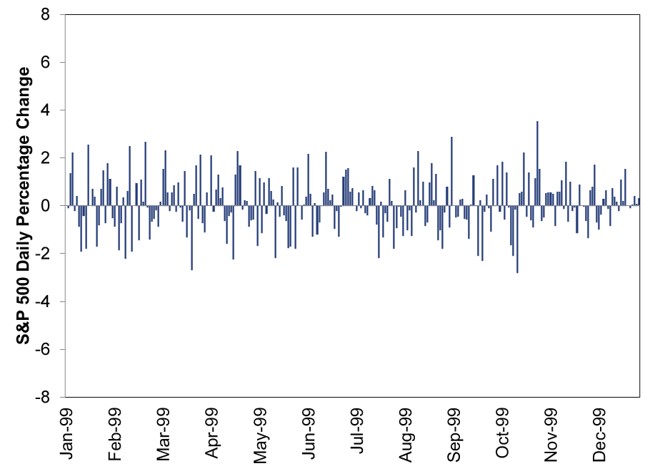
Source: Global Financial Data, Inc. and FactSet, as of 11/14/2017. S&P 500 annual total return and daily price movement, 12/31/1998 12/31/1999.
Exhibit 5: 2009up 26.5%
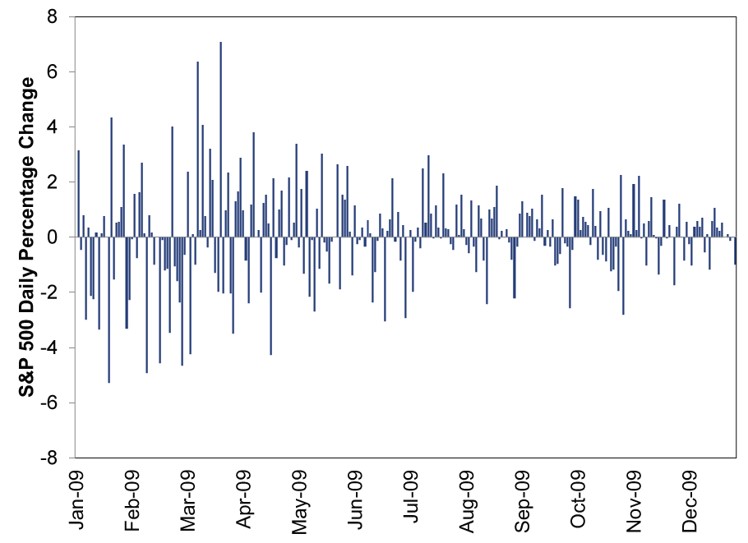
Source: Global Financial Data, Inc. and FactSet, as of 11/14/2017. S&P 500 annual total return and daily price movement, 12/31/2008 12/31/2009.
Exhibit 6: 2017up 17.5% Year-to-Date
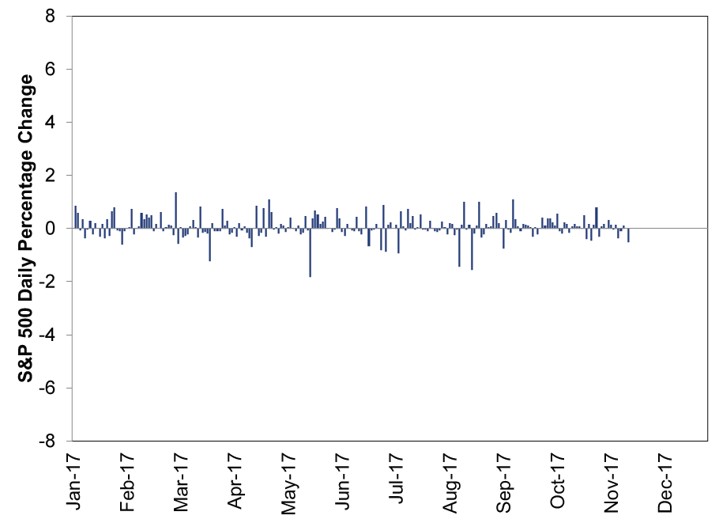
Source: Global Financial Data, Inc. and FactSet, as of 11/14/2017. S&P 500 total return year-to-date and daily price movement, 12/30/2016 11/13/2017.
Dont sweat short-term price movements. Stocks may rise or fall,[vi] amid high or low volatility, but volatility by itself wont tell you which direction.
[i] Up through yesterday, when it dropped -0.55% d/d.
[ii] What option traders think volatility will be.
[iii] Source: Global Financial Data, Inc., as of 11/15/2017. The streak is actually 12 straight up months19 of the last 20. Which is impressive but not unprecedented. The S&P 500 rose in 15 straight months in 1958 1959 and 20 of 21 months from 1949 1951, both records since reliable data begin in 1926. There was also a streak of 23 straight up months from 1801 1802, which is probably related to falling uncertainty over the First Barbary War.
[iv] Includes 23 developed and 24 Emerging Markets.
[v] Neither do expected price movements and bets placed on or hedged against them in options markets.
[vi] Mostly rise, over time.
Source: MarketMinder
| 
