
|
|
| Missing/Avoiding the Best & Worst Days of S&P500 from 1993 to 2010 |
Assuming that you can avoid the 10 worst days, you will have to do so in a way that does not have you missing the 10 best days. If you manage to avoid all of the worst days, but miss all of the best days too, then your portfolio performance will be close to buy & hold (minus transaction costs).
|
|
Buy and Hold, 10 Best Days Removed, 10 Worst Days Removed vs. 10 Best and 10 Worst Days Removed: 1993 - 2010
Click on the picture for a larger view
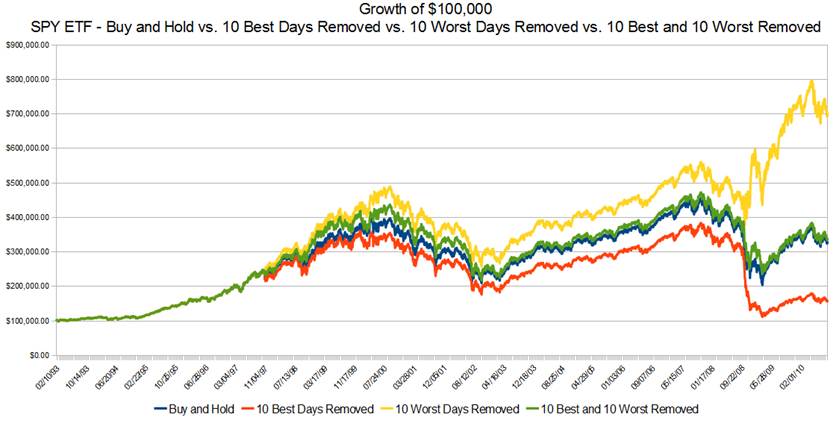
Key takes:
- The 10 best days account for 50% of the buy and hold performance
- Missing the 10 Best Days gives up more than 50% of the Buy & Hold performance
- If you manage to avoid the 10 Worst Days, your portfolio more than doubles the Buy & Hold performance
|
Pension Partners, LLC, September 2010-Michael A. Gayed
13.04.2013
|
|
|
|
|
|
Themes
Asia
Bonds
Bubbles and Crashes
Business Cycles
Central Banks
China
Commodities
Contrarian
Corporates
Creative Destruction
Credit Crunch
Currencies
Current Account
Deflation
Depression
Equity
Europe
Financial Crisis
Fiscal Policy
Germany
Gloom and Doom
Gold
Government Debt
Historical Patterns
Household Debt
Inflation
Interest Rates
Japan
Market Timing
Misperceptions
Monetary Policy
Oil
Panics
Permabears
PIIGS
Predictions
Productivity
Real Estate
Seasonality
Sovereign Bonds
Systemic Risk
Switzerland
Tail Risk
Technology
Tipping Point
Trade Balance
U.S.A.
Uncertainty
Valuations
Yield
|

