Analytics

 Investment Office

Selecting relevant market observations

Investment Thoughts
Macro Observations
Capital Markets
Markets in History
Beyond Finance
Quotes on the Fly
Chart Gallery
Academia
Coffee Chronicles
Archives
Asset Management
Pension Funds
Family Offices
Wealth Managers
Asset Managers
About
Disclaimer
Privacy Policy
Cookie Policy

   Investment Thoughts - Chart Gallery

Returns are almost never average
Excerpt


Annual stock and bond returns, 1926–2016

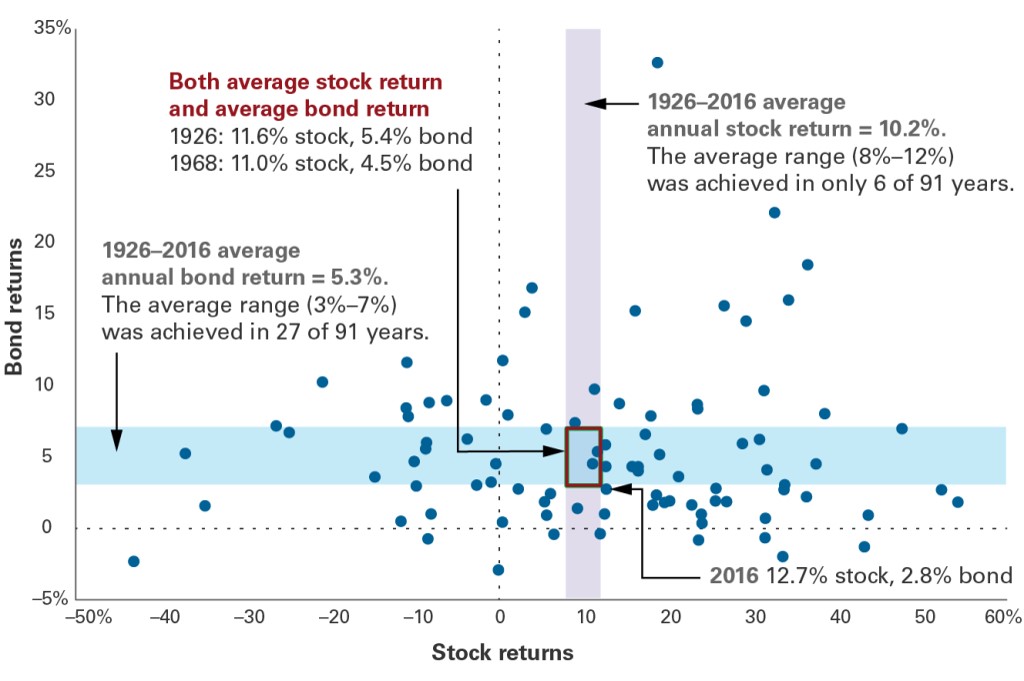
Notes: Represents each calendar year from 1926 to 2016 (91 points = 91 years) plotted at the intersection of that year’s stock return and that year’s bond return. The vertical shaded area contains all years whose stock return was between 8% and 12%. The horizontal shaded area contains all years whose bond return was between 3% and 7%. Stock returns are represented by the Standard & Poor’s 90 Index from 1926 through March 3, 1957; the S&P 500 Index from March 4, 1957, through 1974; the Dow Jones Wilshire 5000 Index from 1975 through April 22, 2005; the MSCI US Broad Market Index from April 23, 2005, through June 2, 2013; and the CRSP US Total Market Index thereafter. Bond returns are represented by the S&P High Grade Corporate Index from 1926 to 1968, the Citigroup High Grade Index from 1969 to 1972, the Lehman Brothers U.S. Long Credit AA Index from 1973 to 1975, the Bloomberg Barclays U.S. Aggregate Bond Index from 1976 to 2009, and the Bloomberg Barclays U.S. Aggregate Float Adjusted Index thereafter.


Vanguard Blog, What’s your benchmark for investment success? November 16, 2017-Donald Bennyhoff

05.12.2017


Themes


Asia

Bonds

Bubbles and Crashes

Business Cycles
Central Banks

China

Commodities
Contrarian

Corporates

Creative Destruction
Credit Crunch

Currencies

Current Account

Deflation
Depression 

Equity
Europe
Financial Crisis
Fiscal Policy

Germany

Gloom and Doom
Gold

Government Debt

Historical Patterns

Household Debt
Inflation

Interest Rates

Japan

Market Timing

Misperceptions

Monetary Policy
Oil
Panics
Permabears
PIIGS
Predictions

Productivity
Real Estate

Seasonality

Sovereign Bonds
Systemic Risk

Switzerland

Tail Risk

Technology

Tipping Point
Trade Balance

U.S.A.
Uncertainty

Valuations

Yield