|
Key Points
The US dollar is cracking under pressure from deteriorating fundamentals and maybe a subtle policy co-ordination following the last G20 Shanghai summit. Could this be Plaza2? The asset allocation implications are significant. We focus here on the potential volatility of G4 bond markets. If the links between Chinese capital outflows, surging G4 bonds and a strong US$ are true, then any reversal in flows will cause a further US dollar sell-off and crashing bond prices as investors flee these safe assets.
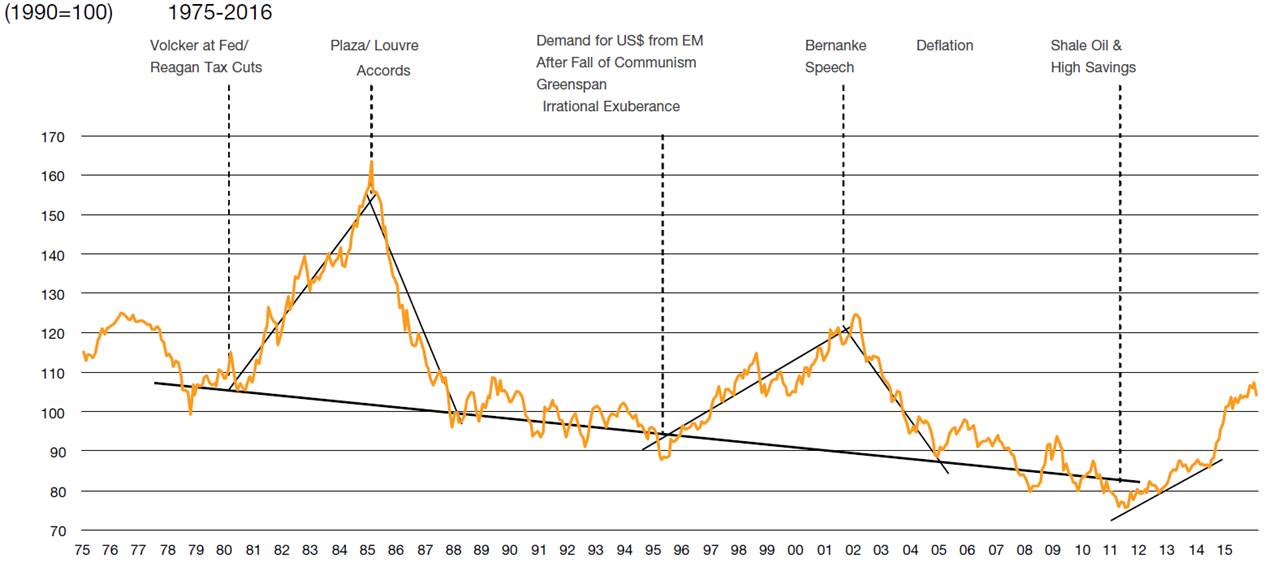
There are few unrelated events in financial markets. The pivotal event in February 2016 was the marked slowing of capital outflows from China. We have long argued that China plays a key role in setting World interest rates. One month does not make a trend and February was a holiday-affected period, but the considerable roadblocks put in place by the Chinese authorities may at last be working to keep capital at home. In addition, there is a strong whiff of gun-smoke from the last G20 meeting in Shanghai (26th-27th February 2016), which may have culminated in this weeks mild FOMC Statement by the US Fed. Is this a new Plaza 2? See Figure 1.
Slowing capital outflows from China must have knock-on effects on the two big recipients of Chinese cash: (1) G4 bond markets and (2) the US dollar. There are signs that the US currency basket has already peaked. What is more, supporting evidence for an end to the dollars bullrun comes from three areas: (1) higher gold and commodity prices; (2) the strong recent bounce in our index of cross-border capital inflows into Emerging Markets, and (3) the beginning of outperformance from value stocks and underperformance from growth stocks. There may also be a fourth reason: co-ordinated policy moves designed to weaken the US dollar, namely limits to how much the Fed will tighten and by how much the BoJ and ECB can now ease. Back in September 1985, G5 policy-makers met at New Yorks Plaza Hotel and agreed to get the soaring US dollar down. It worked then
too well! (The trade weighted dollar fell by more than 40% over the next 3 years.)
Figure 1
US Dollar Trade-Weighted Index
Click on the chart for a larger view
Source
CrossBorder Capital, Bank of England
Our focus in this report concerns the implications of a weaker US dollar and slowing flight capital for bond yields. US Treasury yields have lately moved higher but not yet by much. The risk to bonds comes from two key areas. First, the slowing and possibly future reversal of Chinese capital outflows will reduce the demand for these safe assets. Second, the companion weakening in both the US dollar and the associated bounce in oil and other commodity prices will add to inflation pressures and, in particular, it may push up the level of inflation expectations embedded in Treasury yields.
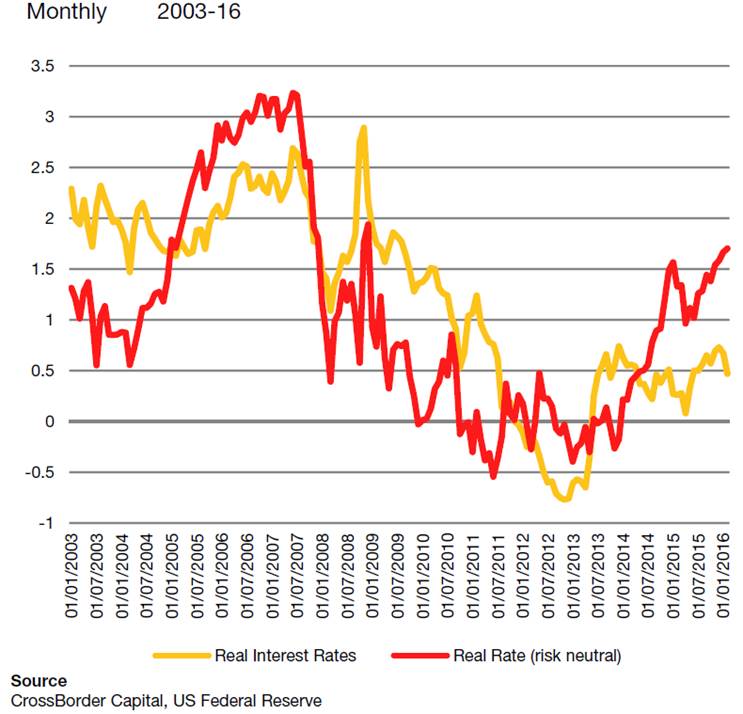
There is potentially a third negative force that could come from rising real interest rates. However, we consider this less likely because real rates have already risen considerably from their lows of minus 0.26% to the latest reading of 1.70% (risk-adjusted), and further rises do not seem consistent with the current slow tempo of the American and World economies (see below).
Figure 2 shows our estimates of the breakdown of US Treasury yields into their three distinct components: (1) risk adjusted real rates; (2) risk-adjusted expected inflation, and (3) risk premia. Recently, falling inflation expectations and collapsing term premia largely explain the fall in nominal yields. Admittedly, according to Figure 3, the first component is probably a tad high at 170bp, but inflationary forces, whether or not they prove to be sustained, are gathering. A weaker US dollar traditionally tends to have a significant positive effect on US inflation expectations, with each 10% drop in the US dollar adding 25-30bp to core inflation and every $10/bbl. rise in oil adding another 5-10bp. Figure 3 plots US breakeven inflation at the 10-year tenor alongside the annual change in the trade-weighted US dollar. Investors should expect 40-50bp to be added to US inflation expectations over the next 12 months.
Figure 2
Breakdown of 10-Year Treasury Yield Components Real Term Rates, Inflation and Term Premia
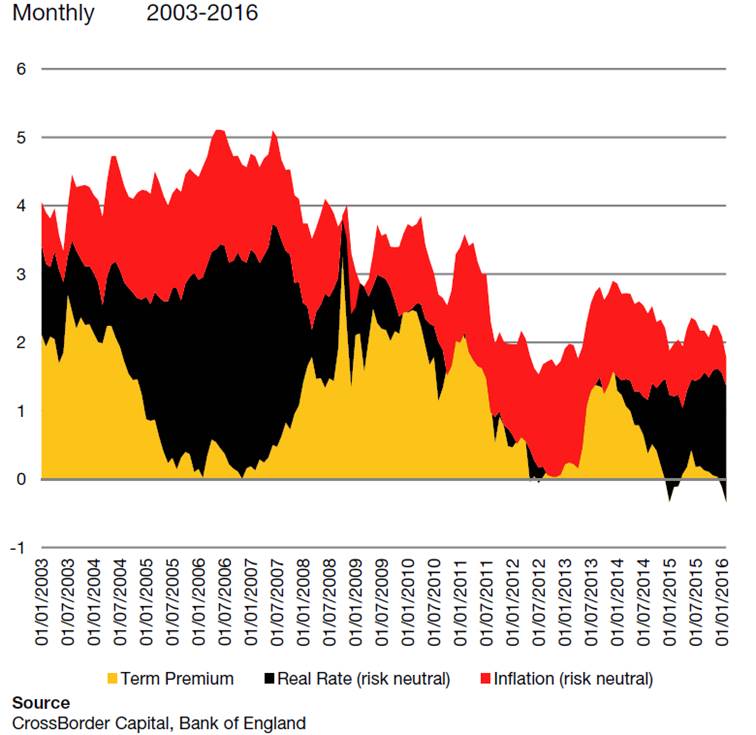
Figure 3
US Real Interest Rates 10-Year Index-Linked and Risk-Adjusted Real Rate
The most powerful force on the slope of the yield curve and long-term bond yields is the term premium. Research by the New York Federal Reserve confirms that term premia explain more than four-fifths of movements in the yield curve (88% since Year 2000). Put another way, changes in short-term interest rates must have only a small effect. Paradoxically, analysts seem to devote most time trying to second guess the Central Banks, whereas in practice they have comparatively little effect, viz. Greenspans famous conundrum.
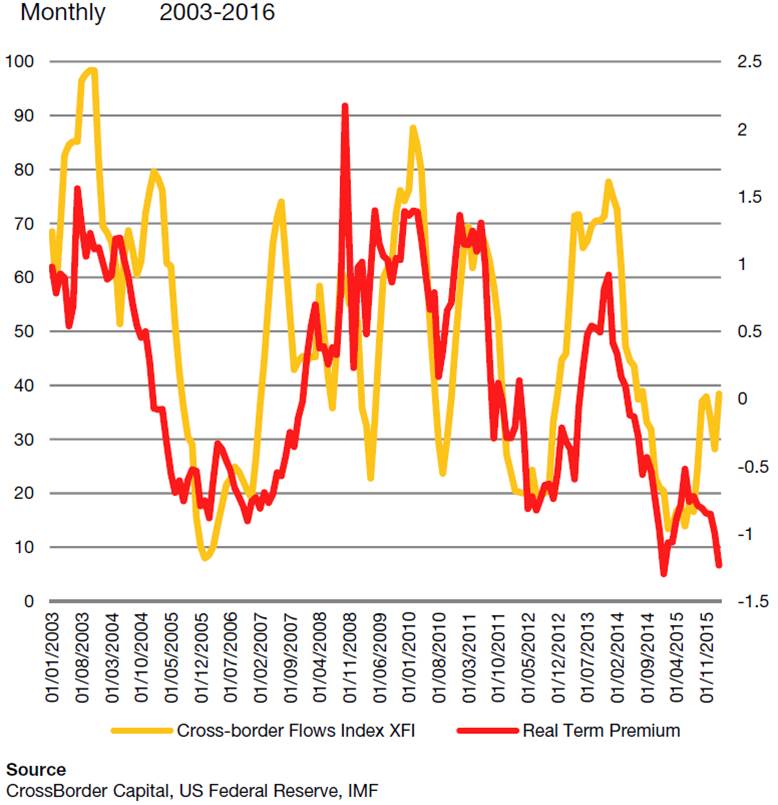
Bond term premia themselves have two components: a slow-moving inflation risk premium and a faster moving and more dominant real term premia. The inflation term premia tend to move with the underlying inflation rate, which is why they change slowly. In contrast, real term premia move with liquidity flows and, lately, with closeness to the pace of cross-border capital outflows from China. This concurs with our belief that these outflows largely consist of flight capital, rather than more benign debt repayments. Hence, G4 bond markets appear to have benefitted from these funds, with 10-year real term premia dropping from a peak of 92bp to a recent low of minus 123bp. This 215bp fall more than explains the 112bp fall in 10-year Treasury yields over the period. Based on the relationship shown in Figure 5, this low and negative value for the real term premia is out-of-line with the latest trends in our index of capital outflows from China. It would seem that a real term premia reading of around zero is more plausible. In other words, 10-year Treasuries could rise in yield by nearly 125bp, equivalent to a fall in price of nearly 9%.
The index shown in Figure 5 and labelled Cross-border Flows Index is simply a normalised z-score of the underlying capital outflow data measured in US dollar terms that we estimate each month. This derives from a methodology that subtracts the current account and net FDI flows from the currency-adjusted monthly change in forex holdings. The residual must correspond to net financial flows. These are reported in Figure 6 for reference. The orange bar represents Chinese net financial flows in millions of US dollars. The latest data show a dramatic slowing from rates of circa US$100-150 billion per month to US$45 billion in February. Clearly, this may be a blip, but it shows we must closely watch future data. The red line on the chart compares China to Hong Kong in order to make the point that the correlation suggests that Hong Kong banks have not seen any evidence of debt repayment from any dollar carry-trades.
Figure 4
Percentage Change in US$ Trade-weighted Index (Inverted, LHS) and US Break-even Inflation Rate (Nominal 10-Year less TIPS, RHS)
Monthly 2003-16
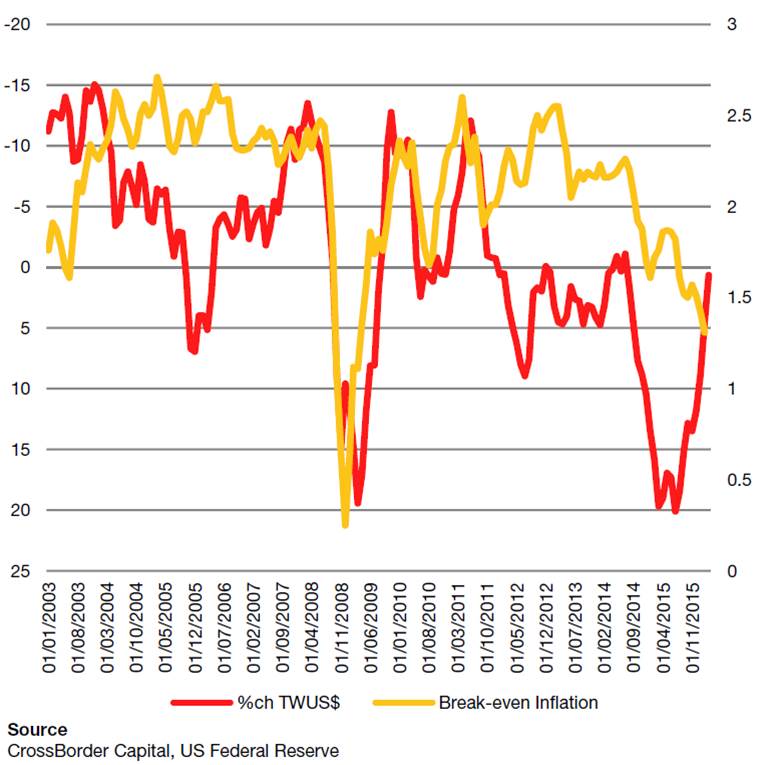
Figure 5
Index of Chinese Cross-Border Flows (Index, LHS) and US 10-Year Treasury Real Term Premia (% points, RHS),
Monthly 2003-2016
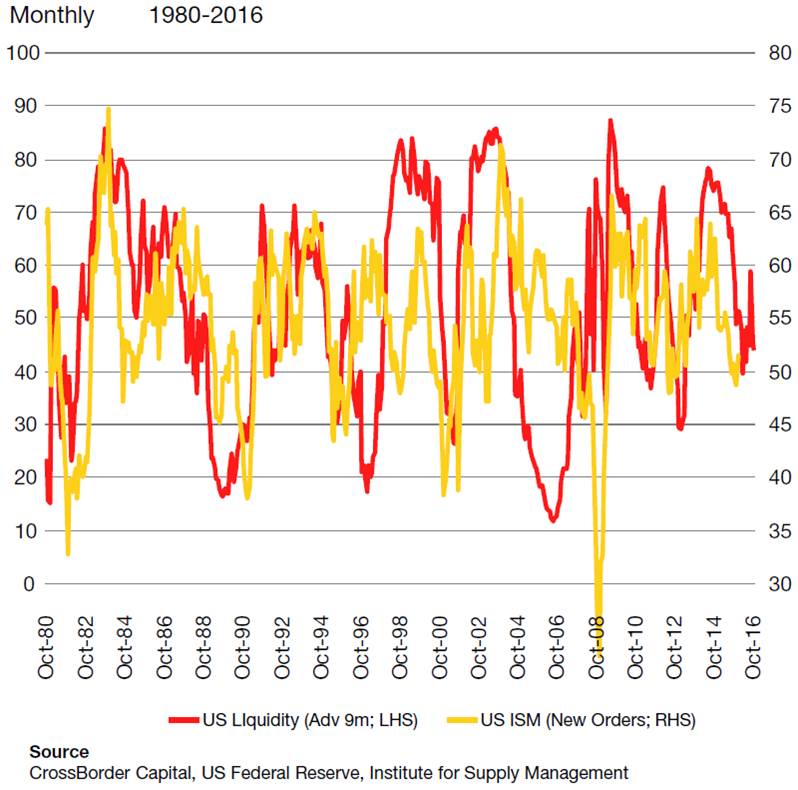
Thus, we conclude that the bulk of Chinese outflows have been flight capital. If this is now slowing, the omens for global bonds look very poor. Term premia could rise by at least 125bp or more and, on top, the weakening US dollar and rising oil prices may push inflation expectations up by an additional 40-50bp. In other words, a US 10-Year yield of 3-3.5% may not seem too fanciful. Yield curves seem likely to steepen again. Corporates must think about borrowing term US dollars now. We could be wrong because the US economy dips back into recession. There are risks here because US Liquidity is low but, as the final chart in Figure 7 shows, the level of liquidity (advanced by 9 months) is not yet consistent with US recession according to the US ISM (manufacturing) index but with stumbling, slow growth.
Figure 6
Chinese and Hong Kong Capital Outflows
US$ Millions Monthly 2009-16
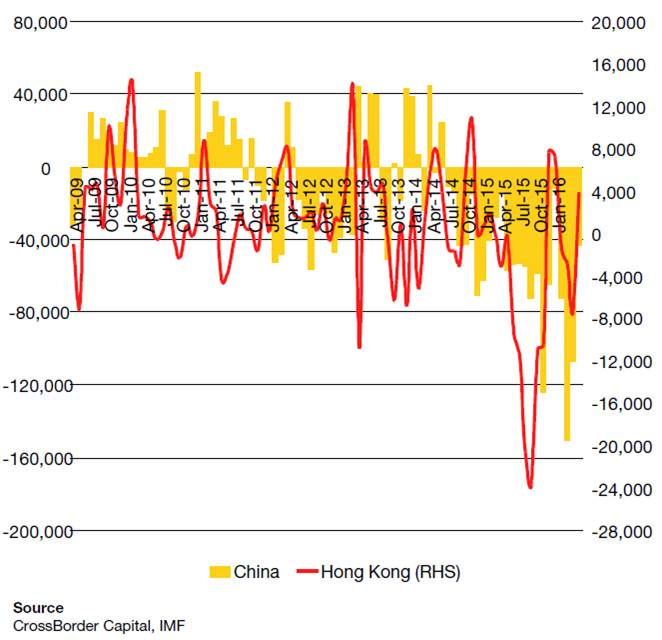
Figure 7
US Liquidity (Advanced 9 months) and US ISM Index (Manufacturing PMI)
|

