|
Our TrackMacro AI program closed 2018 highlighting the continuous deterioration of macro fundamentals across the board. This automated analysis has since been confirmed by the IMF and three major central banks from China, the Euro zone, and the US. As for the FED, this represents a substantial view change for the short term.
January 2019, however, proved that the cautious stance adopted by the system was deeply wrong, with global equities rebounding circa +7%. This is an explicit opportunity loss.
What does the economic theory say about opportunity cost? And what does it not
say?
Bastiat and the Broken Window Fallacy
In 1850, the French economist Frederic Bastiat introduces the concept of opportunity cost with a fallacy in Chapter I of his book Ce quon voit et ce quon ne voit pas (What we see and what we dont see). In Bastiats tale, a mans son breaks a pane of glass, which ultimately stimulates the economy. The father spends six francs to the glazier to replace the window. The glazier then presumably spends the extra money on something else, which increases the velocity of money and benefits the whole society.
Bastiat then exposes the fallacy. The broken glass reduced the mans disposable income, which could have been spent or invested in valuable goods or assets. If the economic theory properly accounted for opportunity cost, the conclusion would be reversed.
In the case of the January 2019 equity rally, are we only looking at the glaziers benefit? And are we sure there is no broken window hidden somewhere?
The Hidden Volatility Regime
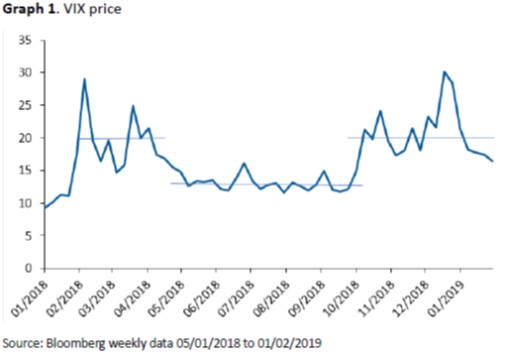
To answer the question, lets first look at the volatility regime we should consider, as illustrated by the VIX price (the implied volatility of the S&P 500) in Graph 1 below. The January market rebound happened in a high volatility regime, which started in October 2018, with a VIX ranging from 18 to 30.
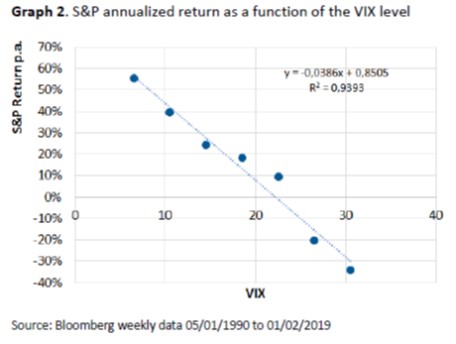
Since 1990, the S&P expected return is a decreasing function of the VIX, as shown on Graph 2 on the next page. In other words, volatility induces ups and downs that destroy value eventually.
When volatility oscillates between 18 and 30, which was the case in the last four months, the S&P annualized expected return ranges between +10% to -30%, with very little value for risk.
The January 2019 market rebound is therefore a likely right-tail event within a high volatility regime, like the sudden glaziers benefit in a global value destruction process.
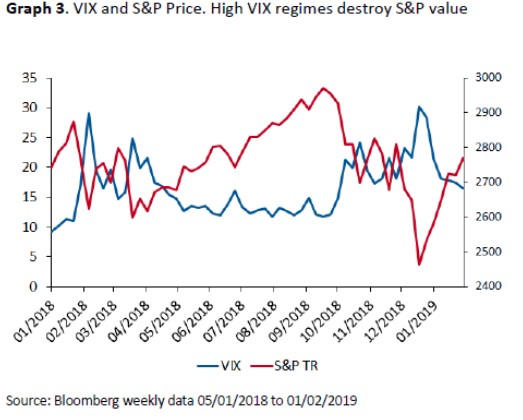
A way to verify the conclusion is to observe the equity market behaviour since October 2018. Graph 3 below illustrates the S&P value loss over the period, combining ups and downs, which is similar to the previous high volatility regime in early 2018.
Fragile and Antifragile Cost of Opportunity
Lets now delve into the measure of opportunity cost with the help of Professor Nicolas Nassim Taleb. Professor Taleb invented the concepts of fragility and antifragility in 2012, which can be summarized as follows.
Fragile objects or people, for their part, benefit from stability and lose value in times of heightened stress. They better avoid future fluctuations and therefore large opportunities that inevitably lead to significant ups and downs. It matters not whether the downs follow or precede the ups. The different events have the same probability of occurrence and the combined fluctuation always destroys value.
Antifragile objects or people, on the contrary, benefit from disruptions. They chase opportunities and high fluctuations.
Our quantitative team spent a large part of 2018 revisiting the concepts of fragility and antifragility from a financial standpoint. Which assets are which? And how to combine them to target heightened portfolio robustness? We will start publishing on the subject by the 15th of this month. The readers that are interested can subscribe on our website (www.gavekal-intelligence-software.com) for a trial period on the new Gavekal Portfolio Solutions (GPS) service.
The conclusions on opportunity loss are the following:
1. The S&P, like most equity markets, is fragile. The S&P produces excess returns in low to medium volatility regimes and destroys value in high volatility regimes. Missing a low volatility market rally is therefore very harmful in the long run but missing a high volatility market rebound is not. Sharp market rebounds are associated with sharp market declines, and the combination always ends in negative territory.
2. Some assets are antifragile, especially in the commodity sphere. For such assets, the conclusion is the opposite. It would be very harmful, for instance, for a gold investor to miss opportunities provided by high gold volatility.
The Global Picture Has Not Changed
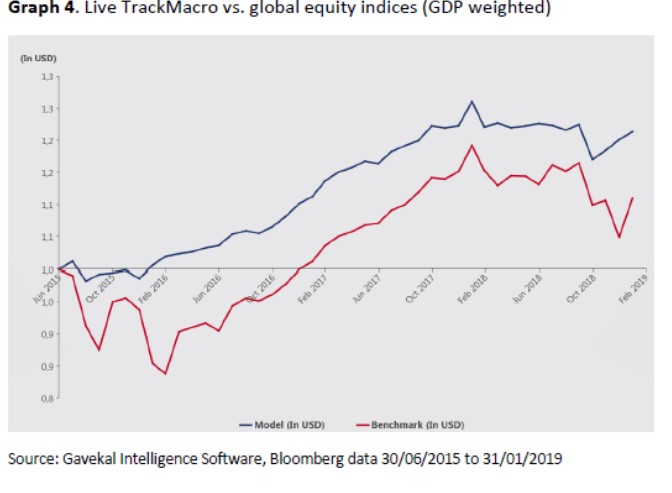
TrackMacro turned extremely defensive at the end of October 2018. Since then, the system returned +5% when global equity markets returned +1%, including the January equity rebound.
The January equity rebound is not part of an opportunity loss for the model, but of an opportunity gain. The real opportunity loss for TrackMacro was October 2018, when it failed to anticipate a volatility spike (the risk regime it should avoid).
Graph 4 below shows the relative performance of TrackMacro vs. a global equity portfolio of the forty countries tracked by the system, weighted by their GDPs.
According to TrackMacro, negative macro factors continue weighing in on equity expected returns and the January market rebound has not changed the picture.
Government bond yields keep falling despite a significant equity rebound. The equity rally is therefore not founded on booming economic activity but, quite to the contrary, on softer tones set by central banks facing potential troubles.
When central banks help funding the replacement of broken windows, TrackMacro shies away from Bastiats fallacy.
| 
