|
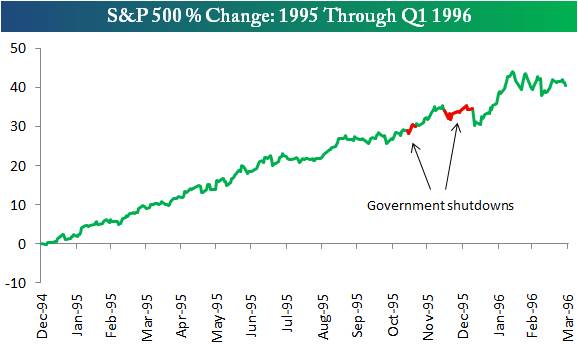
The first occurred from November 14th, 1995 through November 19th, 1995, while the second occurred from December 16th, 1995 through January 6th, 1996.
As shown below, the market basically shrugged off the entire event. The S&P 500 actually moved higher during both shutdowns, and its only declines came briefly in the aftermath of the second shut down.
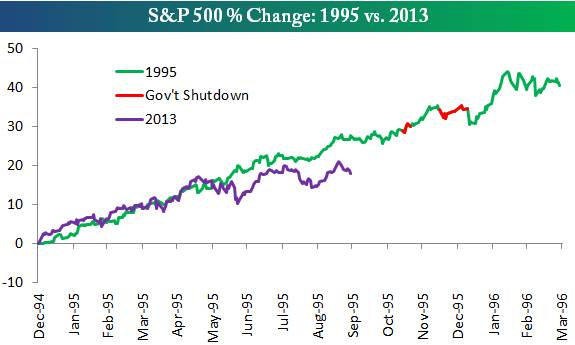
Ironically, the market's action in 2013 has been compared to the market's action in 1995 quite a bit this year, even without the government shutdown parallel. As shown in the chart below comparing the S&P's action in both years, the first five months of this year tracked 1995 very closely. Since June, the S&P hasn't been able to keep up the pace of gains that it saw in 1995, so the correlation isn't as high as it was, but the patterns remain similar.
This work is licensed under a Creative Commons License.
|

