|
It has been a summer of love for the stock market. As the temperatures heated up, so did the stock market. From June 24 to August 2, 2013, the S&P 500 Index rose 9%, pushing stocks up about 20% for the year. The last time we saw stocks perform the way they have this year in both pattern and magnitude was 1967 (Figure 1).
1 Summer of Love for Stocks
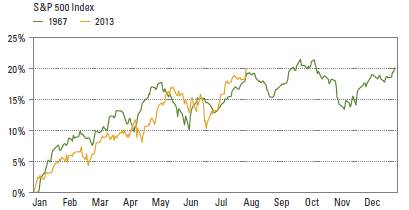
Source: Bloomberg, LPL Financial Research 08/05/13
Past performance is no guarantee of future results.
The S&P 500 Index is unmanaged and you are unable to invest into it directly. The returns do not reflect any fees, expenses or sales charges. Index performance is not indicative of any particular investment.
During 1967s Summer of Love, the Haight-Ashbury neighborhood of San Francisco became the center of a cultural movement known as the Hippie Revolution, but there was a lot more going on economically and socially that offer parallels to today that could explain the stock market similarity:
- Bond yields rose over the course of 1967, but most notably from April to August when the 10-year Treasury note rose about one percentage point similar to this years move over the same time period.
- Gross domestic project (GDP) averaged a lackluster 2% in the first half of 1967, not too far from the 1.4% growth seen in 2013s first half.
- Earnings per share growth for S&P 500 companies was pretty flat on a year-over-year basis then and now.
- Protest politics took place around the world in 1967; this year, Egypt and Brazil are two of the hot spots for protest-driven societal change.
- Recent events still bring forth faint echoes of the race and gender equality struggles of 1967.
- Detroits bankruptcy was almost 46 years to the day that the Detroit riots of 1967 broke out and are considered to be the seminal event that started the erosion of the tax base that left the city to declare bankruptcy in 2013.
- President Obamas Affordable Care Act and other programs have drawn comparisons to President Johnsons Great Society programs passed in the mid-1960s, which included Medicare, the extension of welfare, and environmental activism, and were seen as part of a host of large government spending programs that would speed economic growth as they came into effect in 1967 and beyond.
- The National Security Agencys (NSA) Project MINARET began in 1967, intercepting electronic communications of U.S. citizens without warrants or judicial oversight. This controversial program can be compared with the revelations in 2013 regarding NSA spying on U.S. citizens.
It can be dangerous to look back selectively. Of course, there are lots of differences between now and 46 years ago, and there is no assurance that stocks will continue to follow the 1967 pattern. Nevertheless, if the pattern in the stock market mirroring 1967 that has unfolded so far this year holds in the second half, we may see a volatile market with a slower pace of gains but more record highs ahead. That historical flashback happens to be consistent with our market forecast for the second half of the year.
|

