
|
|
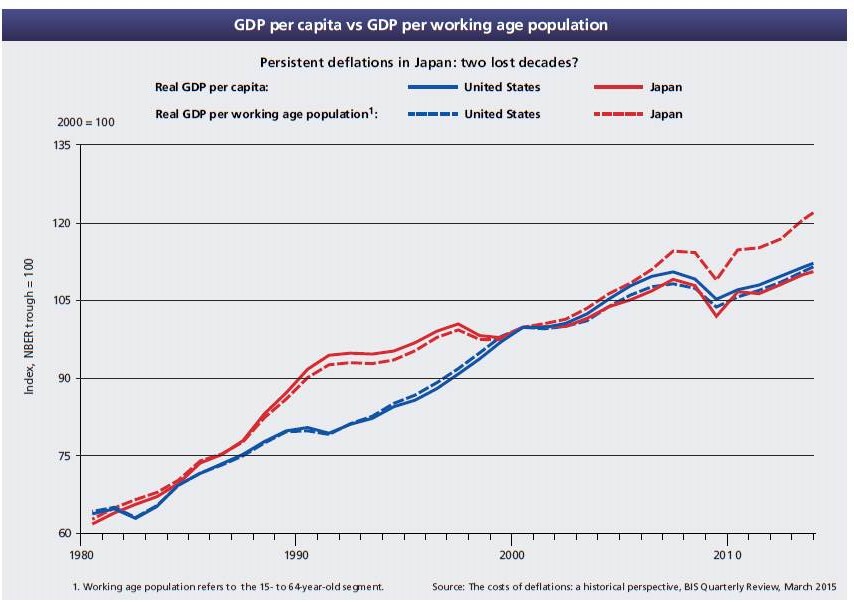
| GDP per capita vs GDP per working age population: United States vs. Japan |
By only looking at GDP per capita one may easily miss the fact that Japans working-age population has been declining since the late 1990s.
|
|
The following chart from the BIS shows GDP per actual working age population, and suddenly Japan doesn't look that bad anymore. It surpassed the United States in the early 2000s and the gap has increased ever since!
GDP per capita vs GDP per working age population, United States vs. Japan
1980 - 2015
Click on the chart for a larger view
|
The costs of deflation: a historical perspective, BIS Quarterly Review, March 2015
08.09.2015
|
|
|
|
|
|
Themes
Asia
Bonds
Bubbles and Crashes
Business Cycles
Central Banks
China
Commodities
Contrarian
Corporates
Creative Destruction
Credit Crunch
Currencies
Current Account
Deflation
Depression
Equity
Europe
Financial Crisis
Fiscal Policy
Germany
Gloom and Doom
Gold
Government Debt
Historical Patterns
Household Debt
Inflation
Interest Rates
Japan
Market Timing
Misperceptions
Monetary Policy
Oil
Panics
Permabears
PIIGS
Predictions
Productivity
Real Estate
Seasonality
Sovereign Bonds
Systemic Risk
Switzerland
Tail Risk
Technology
Tipping Point
Trade Balance
U.S.A.
Uncertainty
Valuations
Yield
|

