|
Pension Funds Switzerland 2019
is made possible thanks to the following sponsors:


|
|
|
Pension Funds - Pensionskassen - Caisses de Pensions
Switzerland 2019
|
|
List of State, Cantons, Cities and Counties Funds |
|
|
| |
List of Corporate Pension Funds | |
|
|
List of Professional and Industry Associations Funds
| |
|
|
Multi-Employers and Collective Schemes | |
The 50 Biggest Pension Funds in Switzerland
Assets are in million SFr, Returns and Funded Ratio, as of 31.12.2018
Source: Markets Tools GmbH
* Source: Thinking Ahead Institute / Pensions & Investments World 300, September 2019
|
articles 1-10 / 16 |
|
|
page 1 of 2
|
»
|
|
| |
Swiss Pension Fund Indices 2019 Q3 YTD Returns
|
Pictet LPP 2000 Indices
Pictet Asset Management SA, October 2019
|
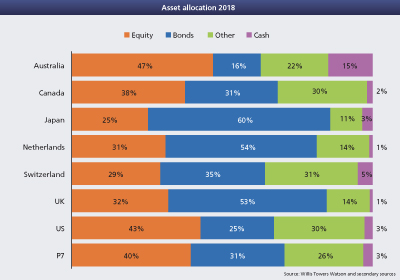
Pension Funds Asset Allocation 2018
|
Global Pension Assets Study 2019 , Willis Towers Watson and secondary sources
|
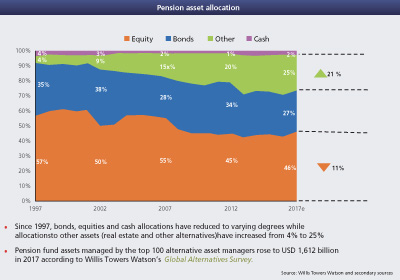
Aggregate P7 asset allocation from 1998 to 2018
|
Global Pension Assets Study 2019 , Willis Towers Watson and secondary sources
|
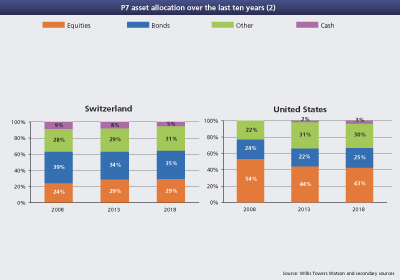
Pension asset allocation, Aggregate end 2008 versus end 2013 versus end 2018
|
Switzerland and the United States
Global Pension Assets Study 2019 , Willis Towers Watson and secondary sources
|
Domestic equity over total equity exposure
|
Global Pension Assets Study 2019 , Willis Towers Watson and secondary sources
|
Domestic bonds over total bond exposure
|
Global Pension Assets Study 2019 , Willis Towers Watson and secondary sources
|
Pension asset allocation, Aggregate end 2008 versus end 2013 versus end 2018
|
Australia, Canada, Japan and the Netherlands
Global Pension Assets Study 2019 , Willis Towers Watson and secondary sources
|
Credit Suisse Swiss Pension Fund Index Chart
|
Breakdown by Segment Size
Credit Suisse, 30.06.2019
|
Credit Suisse Swiss Pension Fund Index Table
|
Asset Allocation for the Last Eight Quarters
Credit Suisse, 30.06.2019
|
Pension asset allocation, P7 in 2018
|
Global Pension Assets Study 2019 , Willis Towers Watson and secondary sources
|
|
|
|
|
|
For institutional investors only
For institutional investors only
Pension Funds Switzerland 2017
For institutional investors only

For institutional investors only
For institutional investors only
pdf Version
Asset Allocation 2018
Switzerland, U.K., U.S., P7 Australia, Canada, Japan, Netherlands
Asset Allocation
from 1998 to 2018
Asset Allocation
Switzerland and the U.S.
end 2008, vs. 2013 vs. 2018
|

